A Guide on Using AGE Viewer For Graph Visualization With AGE Author : Matheus Farias de Oliveira Matsumoto
Apache AGE Viewer is a web-based user interface which displays graph data saved in a PostgreSQL database that uses the AGE extension. This application allows you to see the database's large number of nodes and edges, modify their look, and even execute queries within it. In this article, we will go through the installation process and some of AGE Viewer's features.
Installation
Before installing AGE Viewer, make sure that you have Node.js installed on your machine and that its version is 14.16.0 or higher, and have pm2 installed (pm2 is a process manager for Node.js). After these prerequisites are verified, clone the AGE Viewer repository with the command:
git clone https://github.com/apache/age-viewer.git
Running AGE Viewer
To begin utilizing Age-Viewer, we must have a PostgreSQL database server operating with the Apache Age Extension. Make sure you are running it. In AGE Viewer’s directory, type the following two commands:
npm run setup
npm run start
The first one will install the required modules, and the second one will run AGE Viewer. Do note that AGE Viewer will start on port 3000 and PostgreSQL uses port 5432. After the last command, AGE Viewer will appear on a page on your default browser.
Connect to Database
When AGE Viewer’s page show on your screen, it will ask you to connect to your PostgreSQL server. There are five fields that need to be filled: Connect URL, Connect Port, Database Name, User Name, and Password. If you are running it locally, then the first field should be filled with localhost, and Connect Port should be 5432.

Control Panel
After successfully connecting to the database, AGE Viewer’s control panel will be updated to display the default graph from your database. This panel is divided in five sections: Query Editor, Node Label, Edge Label, Properties, and a Session Settings.

Query Editor : It is divided into two parts: the text box and the three icons. The text box allows us to write our SQL queries there. The first icon, the Play symbol, is used to execute the query that it is typed in the text box. The second icon, an Up Arrow, removes the other sections from the screen. The third icon, the Toggle Switch, when clicked, moves the Graphs to be outside or inside the Session Settings section.
Node Label : This section displays all the available nodes within the current selected graph. When clicking in the (*) symbol, it will generate a query in the text box of the Query Editor that, when executed, will show all the available nodes stored in the graph in the Viewer Panel. In a graph with other node labels, when clicked on one of those, it will generate a query to fetch nodes only with that label.

Edge Label : This section displays all the available edges within the current selected graph. When clicking in the (*) symbol, it will generate a query in the text box of the Query Editor that, when executed, will show all the available connections stored in the graph in the Viewer Panel. In a graph with other edge labels, when clicked on one of those, it will generate a query to fetch connections with only that label.

Properties : This section allows us to query for selected properties from nodes and edges within our graph.
Session Settings : This section allows us to change the graph that we are analyzing with Current Graph drop-down list button, refresh the session with the most recent data with the Refresh button, and also close the session with Close Session.

View Panel
The View Panel is were the nodes and edges fetched from the query are displayed.

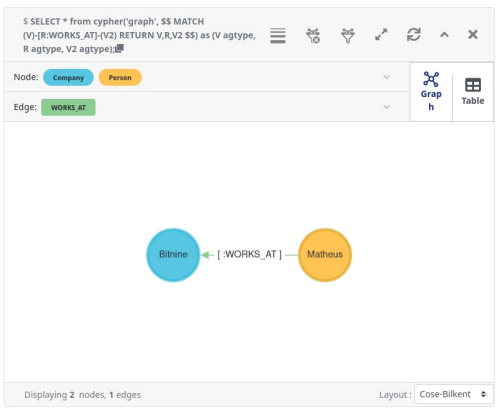
At the top left corner of the View Panel, it is displayed the query that was executed. Next to it, there are seven buttons: Edge Weight, Cancel Search, Filter/Search, Expand, Refresh, Hide, and Close Window.

Filter/Search: It allows us to filter out different properties in our View Panel, showing only the nodes and edges that match the applied filter.

Cancel Search : Will remove all the filters applied to the View Panel
Edge Weight : When clicking this button, it is possible to customize the graph visualization based on edge weights. The user can select specific edges, choose the property representing the edge weight, and filter out edges based on their weight values. This flexibility allows users to gain insights and identify patterns in the graph data more effectively.
Expand : Allows the Panel View to resize and expand to full screen.
Refresh : Will refresh the Panel View if clicked.
Close Window : Closes the Panel View if clicked.
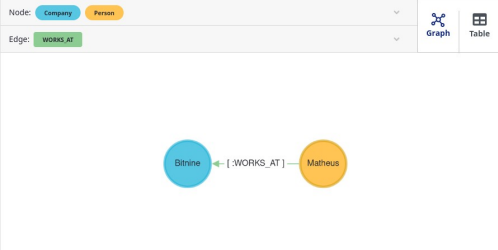
Below these buttons there are the node and edge labels columns, the selection between graph and table screen, and the Panel View’s main screen.

Clicking on one of the labels allows us to change it’s properties at the bottom of the screen.

With this, it is possible to modify the color of the nodes and edges of the selected label, it’s size, and it’s caption.
At the bottom right corner of the screen, there is a Layout drop-down list button. When clicking it, a list of available layouts will appear, allowing the user to select different form of visualizing the graph.

Conclusion
I hope this article has sparked your interest and curiosity in exploring the capabilities of AGE Viewer and a decent understanding on how to use it. AGE and AGE Viewer are both open source projects, if you are interested in knowing more about it, upcoming improvements and in-development features, joining the AGE community, checkout the links below:
Discord channel: https://discord.com/invite/NMsBs9X8Ss/
AGE Website: https://age.apache.org/
AGE GitHub: https://github.com/apache/age
AGE Viewer GitHub: https://github.com/apache/age-viewer
글 : Matheus Farias de Oliveira Matsumoto ( 비트나인 북미 지사 AgeDB )
'GRAPH DB > Graph Solution' 카테고리의 다른 글
| 그래프 기반 추천 시스템이란? (0) | 2022.03.21 |
|---|---|
| G-PAS 실전편 2부: 회귀와 분류로 알아보는 지도 학습 (0) | 2022.02.25 |
| G-PAS 실전편 1부: 관계형 데이터를 그래프 데이터로 변환하는 방법 (0) | 2022.02.22 |
| G-PAS 이론편: 그래프 DB를 활용한 예측 분석 (0) | 2022.02.14 |
| G-PAS, 빅데이터 예측분석 시스템 (0) | 2020.12.21 |